


What is Bollinger Band? Learn Bollinger Band Formula & Uses
What is Bollinger Bands Indicator? A Comprehensive Guide
Introduction
Have you ever wondered how traders predict market movements? One popular tool they use is the Bollinger Bands Indicator. But what exactly is it, and how can it help you in trading? If you've ever felt overwhelmed by stock market charts, don’t worry—we’ll break it down in simple terms!
A Bollinger Band is a technical analysis tool that helps traders identify price volatility and potential buy or sell opportunities. Think of it as a rubber band around the price—when it stretches, the market is more volatile; when it contracts, the market is calmer.
What is Bollinger Band? Learn about the Bollinger Band formula, its uses in trading, and how to analyze market trends effectively with this powerful indicator.
What is Bollinger Band?
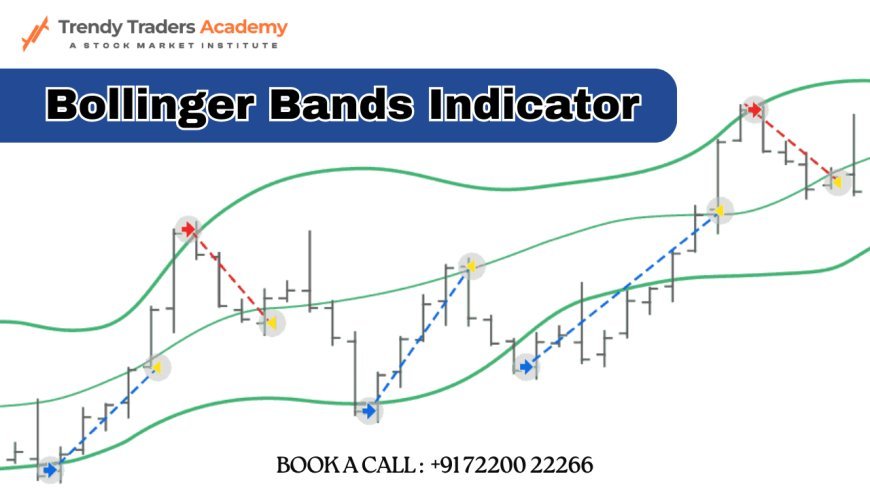
Bollinger Bands were developed by John Bollinger in the 1980s to help traders assess market volatility. The indicator consists of three main components:
-
Middle Band: A simple moving average (SMA) of the price.
-
Upper Band: The SMA plus two standard deviations.
-
Lower Band: The SMA minus two standard deviations.
These bands expand and contract based on market volatility, helping traders determine price trends and potential reversals.
Understanding Bollinger Band Formula
The Bollinger Band formula consists of:
-
Middle Band: 20-day simple moving average (SMA)
-
Upper Band: SMA + (Standard Deviation * 2)
-
Lower Band: SMA - (Standard Deviation * 2)
This calculation helps traders visualize market trends and identify potential entry or exit points.
How to Interpret Bollinger Bands?
-
Price touching the upper band: The asset may be overbought, signaling a potential reversal.
-
Price touching the lower band: The asset may be oversold, indicating a possible buying opportunity.
-
Bands widening: Higher volatility in the market.
-
Bands contracting: Lower volatility, often preceding a breakout.
Why Are Bollinger Bands Useful in Trading?
Bollinger Bands help traders:
-
Identify trends and reversals.
-
Measure market volatility.
-
Spot trading opportunities.
They are widely used in stocks, forex, and cryptocurrency trading.
How to Use Bollinger Bands Effectively?
-
Combine with other indicators: Use RSI or MACD for better accuracy.
-
Observe market conditions: Don’t rely on Bollinger Bands alone; consider the overall trend.
-
Avoid false signals: Not every touch of the band means a trend reversal.
Common Trading Strategies with Bollinger Bands
-
Bollinger Band Squeeze: When the bands contract, a breakout is likely.
-
Reversal Trading: Buying at the lower band and selling at the upper band.
-
Breakout Strategy: Enter trades when price breaks out of the bands.
Bollinger Band Squeeze: What Does It Mean?
A Bollinger Band squeeze occurs when the bands contract, signaling low volatility. This often precedes a strong price movement or breakout.
Limitations of Bollinger Bands
-
Can give false signals.
-
Not effective in all market conditions.
-
Works best when combined with other indicators.
Bollinger Bands vs Other Indicators
|
Indicator |
Purpose |
|
Bollinger Bands |
Measures volatility & trends |
|
RSI (Relative Strength Index) |
Identifies overbought/oversold conditions |
|
MACD (Moving Average Convergence Divergence) |
Detects trend changes |
Tips for Beginners Using Bollinger Bands
-
Start with a demo account.
-
Use them alongside other indicators.
-
Don’t assume every band touch means a trade opportunity.
Conclusion
Bollinger Bands are a powerful tool for traders, helping to analyze market trends and identify trading opportunities. However, they should not be used in isolation. By combining them with other indicators and market analysis, traders can make more informed decisions.
Understand Bollinger Bands, their formula, and how they help traders assess market trends, volatility, and trading opportunities for better investment decisions. Bollinger Bands help traders analyze market trends, measure volatility, and identify potential trading opportunities. Learn how to use them effectively in this guide.
FAQs on Bollinger Bands Indicator
What is the best setting for Bollinger Bands?
The default setting is a 20-day SMA with two standard deviations, but traders can adjust this based on their strategy.
Can Bollinger Bands be used for cryptocurrency trading?
Yes, Bollinger Bands work well in crypto trading as they help identify volatility and price movements.
Do Bollinger Bands work in all market conditions?
They work best in trending markets but can provide false signals in sideways markets.
How do I use Bollinger Bands for day trading?
Look for band squeezes, reversals, and breakouts while confirming with other indicators like RSI.
Are Bollinger Bands suitable for beginners?
Yes, but beginners should first practice with a demo account and learn other indicators for better accuracy.
What's Your Reaction?